
Filter Guide for Various Fluorescent Reagent (Ex/Em)
Fluorescence Reagent Filter Guide (Ex / Em)
This page provides a practical reference for selecting suitable LED wavelengths and emission filters based on excitation (Ex) and emission (Em) spectra of commonly used fluorescent reagents in gel imaging and fluorescence observation.
- EXCITATION (EX)
- EMISSION (EM)
- LED WAVELENGTH
- EMISSION FILTER
- DICHROIC FILTER
Selection Principle:Choose an LED wavelength that efficiently excites the fluorophore, and combine it with an emission filter that blocks excitation leakage while transmitting fluorescence emission. When excitation and emission spectra are close or overlapping, additional filtering such as a dichroic filter may be required to reduce background glow.
Quick Reference Table
Each row lists a reagent with its peak excitation (EX) and emission (EM) wavelengths. Click any row to jump to the detailed LED wavelength and filter combination for that reagent.
| Reagent | EX nm | EX (Sub) | EM nm |
|---|---|---|---|
| Alexa Fluor 532 | 532 | 554 | |
| Cy3 | 550 | 570 | |
| DsRed | 557 | 579 | |
| EtBr | 300 | 518 | 605 |
| FITC | 490 | 525 | |
| Flamingo | 512 | 271 | 535 |
| Gel Green | 250 | 500 | 530 |
| Gel Red | 270 | 510 | 600 |
| GFP | 488 | 507 | |
| mCherry | 580 | 610 |
| Reagent | EX nm | EX (Sub) | EM nm |
|---|---|---|---|
| mCitrine | 516 | 529 | |
| Midori Green | 490 | 290 | 530 |
| SYBR Gold | 495 | 540 | |
| SYBR Green I | 498 | 522 | |
| SYPRO Orange | 470 | 570 | |
| SYPRO Red | 550 | 300 | 630 |
| SYPRO Ruby | 280 | 450 | 620 |
| TagRFP | 555 | 583 | |
| tdTomato | 554 | 581 | |
| YFP | 513 | 527 |
* Additional Ex/Em Reagent List Reagent List
Notice: This guide is intended for reference purposes only. It does not guarantee visibility of any specific fluorescence signal. Actual results may vary depending on LED intensity, filter quality, optical configuration and camera specifications.
Symbol Meaning
- ◎ Most suitable
- ◎* Most suitable
but an additional long-pass or dichroic filter may be required to reduce background. - ○ Suitable
- △ Usable, but with limited effectiveness compared with ◎ and ○.
- × Not recommended


For cellular labeling in fluorescence microscopy and in cell biology.
Retains sulfonic acid which is directly connected to the fluorescent. Especially bright with rhodamine derivative. The reagent with great light stability
Thermo Fisher Info
| Ex | Effcy | Filter evaluation | |
|---|---|---|---|
| SC-56 | SC-60 | ||
| 470 nm | △ | △ | △ |
| 505 nm | ○ | ◎* | ○ |
| 530 nm | ◎ | × | ○ |
Excitation and emission wavelengths are very close, making it difficult to separate fluorescence emission from excitation leakage. A 505 nm LED with an SC-56 emission filter is effective. Additional filtering to block longer wavelength leakage is recommended to reduce background when used with transmitted light source.


In addition to such biological assays as immunocytochemistry, Cyanine dye fluorescence reagent is often used for labelling RNA.
Thermo Fisher Scientific Info
| Ex | Effcy | Filter evaluation | |
|---|---|---|---|
| SC-56 | SC-60 | ||
| 470 nm | △ | △ | △ |
| 505 nm | ○ | ◎* | ○ |
| 530 nm | ◎ | × | ○ |
Excitation and emission wavelengths are close, making it difficult to separate fluorescence emission from excitation leakage. A 505 nm LED with an SC-56 emission filter is effective. Additional filtering to block longer wavelength leakage is recommended to reduce background when used with transmitted light source.

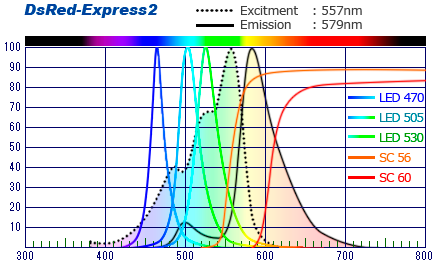
Exhibits strong and stable expression in bacterial cells with minimal toxicity.
TAKARA Info
| Ex | Effcy | Filter evaluation | |
|---|---|---|---|
| SC-56 | SC-60 | ||
| 470 nm | △ | ○ | △ |
| 505 nm | ○ | ◎* | ◎ |
| 530 nm | ◎ | × | ◎ |
Excitation and emission peaks are close, but the spectra are broad enough that separation is relatively easier. Blue, cyan and green LEDs can be used for excitation, and a red emission filter is effective for separation.


Ethidium bromide is one of the most widely used reagents for nucleic acid band staining. It is treated as hazardous waste by many organizations and requires appropriate handling and disposal.
WIKIPEDIA Info
| Ex | Effcy | Filter evaluation | |
|---|---|---|---|
| SC-56 | SC-60 | ||
| 470 nm | △ | △ | △ |
| 505 nm | ○ | ◎* | ○ |
| 530 nm | ○ | × | ○ |
EtBr has a strong excitation peak in the UV region around 300 nm and can also be excited in the visible range around 480 to 520 nm.
LED505 / LED530 can be used, but sufficient light intensity and effective filtering are important to reduce background glow.

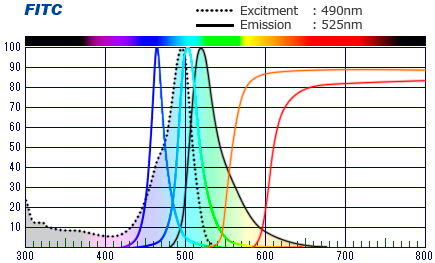
A type of fluorochrome widely used for microscopic observation. Often utilized for bloodstain search, dye tracking in the area of forensic medicine and serology
WIKIPEDIA Info
| Ex | Effcy | Filter evaluation | |
|---|---|---|---|
| SC-56 | SC-60 | ||
| 470 nm | △ | △ | × |
| 505 nm | ○ | ○* | △ |
| 530 nm | △ | × | × |
The excitation peak is around 490 nm, and excitation with a 505 nm LED is possible. However, because excitation and emission wavelengths are close, background-suppression optics may be required. A high-power blue LED with an appropriate emission filter can also be effective.


Low cost protein detection with simple protocol. High sensitivity and quantitatively enables identification of protein by mass spectrometry. Compatible also with UV excitation.
BIO-RAD Info
| Ex | Effcy | Filter evaluation | |
|---|---|---|---|
| SC-56 | SC-60 | ||
| 470 nm | △ | △ | × |
| 505 nm | ○ | ○* | △ |
| 530 nm | × | × | × |
Ex 512 nm and LED505 nm can be effective. LED device with background eliminating feature or high power blue LED & SC52 pair can also be effective since Ex/Em is close.
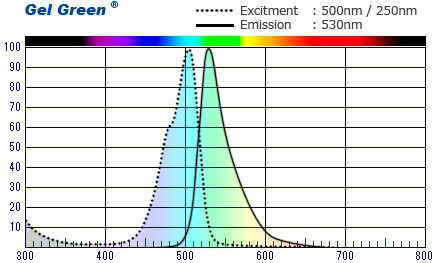

Green fluorescent nucleic acid dye designed to replace the highly toxic EtBr. Compare to EtBr, it is ultra-sensitive and very stable, both hydrologically and thermally. Very simple procedures for pre or post staining
BIOTIUM Info
| Ex | Effcy | Filter evaluation | |
|---|---|---|---|
| SC-56 | SC-60 | ||
| 470 nm | △ | △ | × |
| 505 nm | ○ | ○* | △ |
| 530 nm | △ | × | × |


Fluorescent nucleic acid dye designed to replace the highly toxic EtBr. Compare to EtBr, it is ultra-sensitive and very stable, both hydrologically and thermally. Very simple procedures for pre or post staining.
BIOTIUM Info
| Ex | Effcy | Filter evaluation | |
|---|---|---|---|
| SC-56 | SC-60 | ||
| 470 nm | ○ | ○ | ○ |
| 505 nm | ○ | ◎* | ○ |
| 530 nm | ○ | × | △ |
Wavelength characteristic is similar to EtBr. Compare to EtBr, it has more abosrption around 520 nm and thus
LED light is effective.


Enables real time detection without damaging cell. It also demonstrate its function as fusion protein (GFP tag) Widely used as a tool to locate protein which is taking part in signal transaction inside the cell.
WIKIPEDIA Info
| Ex | Effcy | Filter evaluation | |
|---|---|---|---|
| SC-56 | SC-60 | ||
| 470 nm | ◎ | ○ | × |
| 505 nm | ◎ | ○* | × |
| 530 nm | ○ | × | × |
Em/Ex peaks are close but Em is spread over to short wavelength side and Blue LED is effective


Red fluorescent proteins isolated from Discosoma sp. Utilizes for fusion expression with target protein, promoter activity monitoring and bacteria expression. Takes short time for expression and stable as well.
TAKARA Info
| Ex | Effcy | Filter evaluation | |
|---|---|---|---|
| SC-56 | SC-60 | ||
| 470 nm | △ | △ | △ |
| 505 nm | ○ | ○* | ○ |
| 530 nm | ○ | × | ◎ |
Em/Ex peaks are close but Em is spread over to short wavelength side and Cyan or Green LED can be used. Excitation with Green LED and separation with red filter is effective.


mCitrine is an empty vector and gene insertion can be achieved by LIC cloning protocol. mCitrine is highly versatile with its compatibility with many other vector as well as usability as single expression vector.
TAKARA Info
| Ex | Effcy | Filter evaluation | |
|---|---|---|---|
| SC-56 | SC-60 | ||
| 470 nm | △ | △ | × |
| 505 nm | ○ | ○* | × |
| 530 nm | △ | × | × |
Ex 510m and 505 nm LED is efficient. However Ex/Em is close and may require LED device with background eliminating features. High power blue LED with SC52 filter is also effective.


Ideal Nucleic acid staining reagent for prestained method. Low background and high S/N ratio makes safe alternative to the ethidium bromide.
NIPPON Genetics Info
| Ex | Effcy | Filter evaluation | |
|---|---|---|---|
| SC-54 | SC-60 | ||
| 470 nm | ○ | ○ | × |
| 505 nm | △ | △ | × |
| 530 nm | × | × | × |
Ralatively easy to excite with Blue LED (470m). Easy to separate since Ex/Em peak has some space between them.


Thermo Fisher Scientific Info
| Ex | Effcy | Filter evaluation | |
|---|---|---|---|
| SC-56 | SC-60 | ||
| 470 nm | ○ | ◎ | ○ |
| 505 nm | ◎ | ◎* | ○ |
| 530 nm | ○ | × | △ |
Relatively easy to excite with Blue and Cyan LED. Easy to separate since Ex/Em peak has some space between them.


Asymmetrical cyanine dye used as a nucleic acid stain in molecular biology. It binds to double helix DNA and can be replacement for EtBr as it is safer to work However any small molecule capable of binding DNA with high affinity is a possible carcinogen, including SYBR Green.
Thermo Fisher Scientific Info
| Ex | Effcy | Filter evaluation | |
|---|---|---|---|
| SC-56 | SC-60 | ||
| 470 nm | ○ | ◎ | △ |
| 505 nm | ◎ | ◎* | △ |
| 530 nm | ○ | × | × |
Ex is similar to SYBR Gold, however Em is adjacent to Ex and bit harder to separate. LED 505 with background eliminating features or high power blue LED & SC52 pair is also effective.


Provides fast, simple, sensitive staining of proteins. Has very little protein-to-protein variation in staining. Enables long lasting and stable emission. With low background, it requires less time for cleaning gel. Detection with immunoreagent is also possible with western blotting.
Thermo Fisher Scientific Info
| Ex | Effcy | Filter evaluation | |
|---|---|---|---|
| SC-56 | SC-60 | ||
| 470 nm | ◎ | ◎ | ○ |
| 505 nm | ◎ | ◎* | ◎ |
| 530 nm | ○ | × | ○ |
Ex is spread over to wide range and both Blue and Cyan LED are highly effective for excitation. With enough space between Ex&Em, it is relatively easy to separate too


For cellular labeling in fluorescence microscopy and in cell biology.
Retains sulfonic acid which is directly connected to the fluorescent. Especially bright with rhodamine derivative. The reagent with great light stability
Thermo Fisher Scientific Info
| Ex | Effcy | Filter evaluation | |
|---|---|---|---|
| SC-56 | SC-60 | ||
| 470 nm | △ | ○ | ○ |
| 505 nm | ◎ | ◎* | ◎ |
| 530 nm | ◎ | × | ◎ |

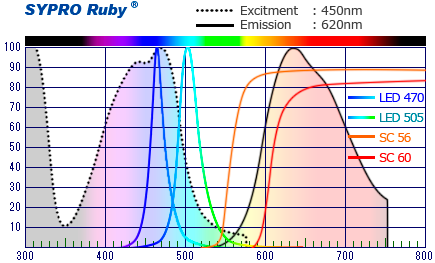
For cellular labeling in fluorescence microscopy and in cell biology.
Retains sulfonic acid which is directly connected to the fluorescent. Especially bright with rhodamine derivative. The reagent with great light stability
Thermo Fisher Scientific Info
| Ex | Effcy | Filter evaluation | |
|---|---|---|---|
| SC-56 | SC-60 | ||
| 470 nm | ◎ | ◎ | ◎ |
| 505 nm | ○ | ◎* | ○ |
| 530 nm | △ | × | △ |
With wide space between the peaks of Ex & Em, it is considered easy reagent for separation. Blue LED is most effective for excitation. Cyan LED is also effective.


Generated from the wild-type RFP from sea anemone entacmaea quadricolor. It is brightest monomeric red fluorescent protein available. Mammalian cells transiently transfected with TagRFP expression vectors produce bright fluorescence in 10-12 hrs after transfection.
Evrogen JSC Info
| Ex | Effcy | Filter evaluation | |
|---|---|---|---|
| SC-56 | SC-60 | ||
| 470 nm | △ | ○ | △ |
| 505 nm | ○ | ◎* | ○ |
| 530 nm | ◎ | × | ◎ |
Cyan, or Green LED is effective for excitation. Em is too close with Green, and background may appear with SC-56 but sould be able to separate with SC-60 since Em is spread over to long wavelength side.


Exceptionally bright red fluorescent protein (2.5x brighter than EGFP) It is easily detected as deep as 1 cm below the surface, and ideal for live animal imaging studies. High cohesion stability make it suitable to produce protein N-, C- fusion protein too.
TAKARA BIO Info
| Ex | Effcy | Filter evaluation | |
|---|---|---|---|
| SC-56 | SC-60 | ||
| 470 nm | △ | ○ | ○ |
| 505 nm | ○ | ◎* | ○ |
| 530 nm | ○ | △ | ○ |
Wavelength characteristics is similar to Tag RFP and Em/Ex are close.
Cyan LED & shortpass filters pair or Green LED & SC-60 filter pair should be used to eliminate background.


YFP is synthetic non-aequorea fluorescent proteins that can be amplified/cut by various PCR and cloned into any other expression vector of choice. These vectors can also be used as expression vectors or as positive controls and allow monitoring of inducible protein expression.
COSMO BIO Info
| Ex | Effcy | Filter evaluation | |
|---|---|---|---|
| SC-56 | SC-60 | ||
| 470 nm | △ | △ | × |
| 505 nm | ○ | ◎* | × |
| 530 nm | × | × | × |
Ex peak at 512 nm and can be excited with 505 nm LED. However Ex/Em is close and may require LED device with background eliminating features. High power blue LED with SC52 filter can also be effective.